Over the past couple of weeks I’ve been working on a framework for creating financial models of the type used in project finance1 1 https://github.com/RedPenguin101/modelling-framework .
In this post I’ll give the background to the domain, the motivation for the framework, some examples, and reflections on how it has turned out after a fortnight of intermittent work.
Financial modelling is a widely used technique in finance to help judge the advisability of potential investments or projects. It involves the prediction of future cash flows and profits, based on a set of inputs. It allows the users of the model to create different scenarios by varying those inputs (“What if I spent less on capex?”)
The ubiquitous tool for creating financial models is the Excel Spreadsheet. The use of Excel to create models is a foundational tool for budding investment bankers, and many will spend their first few years getting very good indeed at creating them2 2 There is even a ‘Excel eSports’ scene. See for example the Financial Modelling World Cup .
The layouts of these spreadsheets vary from person to person, but they typically involve the following core elements:
Typically the modeller will be creating time series for elements like operations, debt and equity, as well as the standard financial statements of cash-flow, income, and balance sheet.
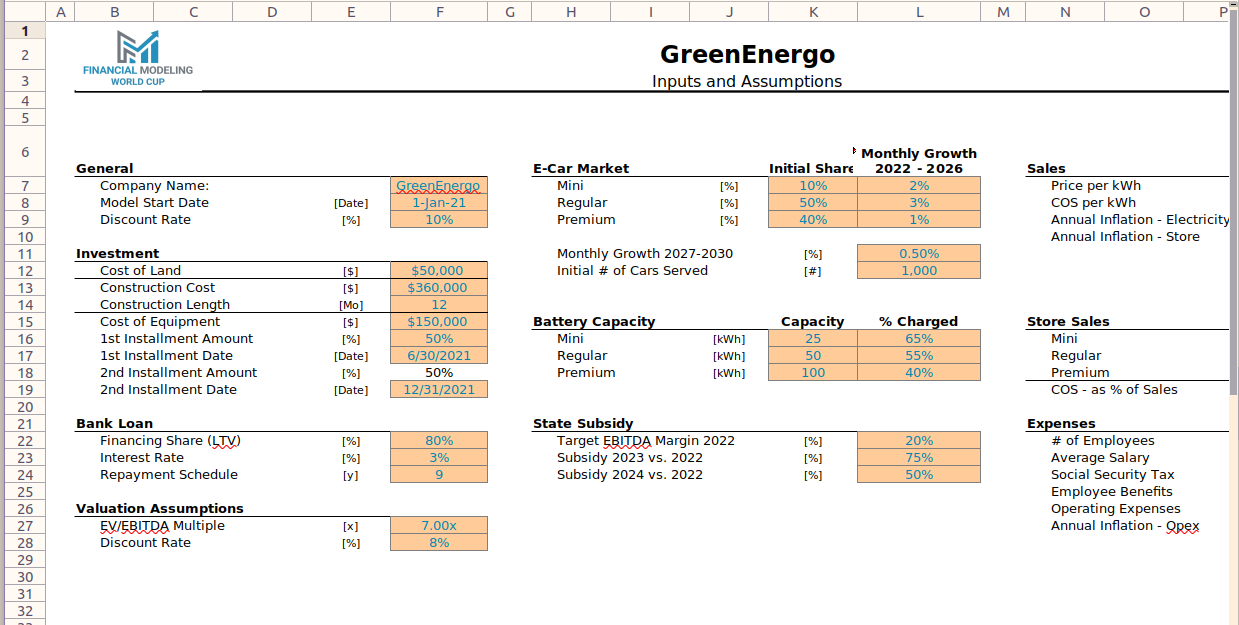
For an idea of the type of problem that is typical in this space, see the Charging Station sample case (note: zip file). The scenario describes creating a model for a typical electric vehicle charging station, involving the modelling of construction of the station, the drawdown and repayment of a debt facility which finances the construction, the sale of electricity based on assumptions about the number of electric vehicles on the road, and a government subsidy. Note that this is a highly simplified version of most ‘real world’ models, meant as it is to be created quickly in a competitive setting.
In all honesty there is not much of a problem with using Excel for creation of these models. It is broadly an excellent match of software to need. I will talk about specific benefits of the Spreadsheet for modelling when I compare it to what I built, but in general the spreadsheet format provides flexibility, and the task-oriented formula on the mostly numeric data-types involved3 3 Dates also feature prominently. give substantial power. My motivation is largely out of curiosity.
There are a few problems that result from the use of spreadsheets, particularly when models start to get large (> 500 rows) and especially when multiple people are required to interact with them. Here are a few I can think of, in no particular order.
Excel models are notoriously difficult to version control. This is difficult even in a single-user capacity - a typical solution will involve ‘saving’ (copying) outputs of the model, then counting the number of changes in those outputs as you change things. This is definitely useful, but first it gives little visibility into why things have changed, and second it doesn’t distinguish between change caused by modification in inputs and changes in the model itself, an important distinction.
Things get rather more bleak when it comes to VC over the longer term and with multiple users. Really the only tools available are the file system and file names, combined with any conventions you have established. This leads to the infamous model_2022_05_04_14_12_version_2_final_3_reviewed.xlsx problem.
While Excel has a bunch of features that are useful for modelling, there are many significant holes. These take the form of quality-of-life shortcuts such as the ability to format cells without leaving the keyboard, visualizations, advanced dependency tracing etc. These are generally implemented as Excel Addins written in VBA4 4 Macabacus is a popular example. .
The main problems with these are that they can be rather opaque, are not very portable, tend to be quite coupled to a particular convention, and the nature of the VBA implementation often means that important features like ‘undo’ are disabled.
Modellers tend to have automatic calculation turned off, and to get into the habit of recalculating sheets and workbooks as they make changes. This is not only because of the size, but it’s part of it. However, if you forget, or if your model does something unexpected, you can often be left scratching your head after you recalculate. Or, of course, you can just forget to recalculate.
This is such a problem that a full quarter of the book Corporate and Project Finance Modeling5 5 https://learning.oreilly.com/library/view/corporate-and-project/9781118854365/ is dedicated to it. From that book
Some elements of project finance analysis and modeling are among the most difficult challenges in programming and cause continuing headaches for modelers. The worst nightmares often result from circular logic, resolution of which can sometimes make a model far less flexible for structuring analysis and can make calculations very difficult to trace.
At base this is a problem of legibility: Why is the circular logic occurring? In a complex model this can be extremely hard to even comprehend, let along resolve, and Excel itself doesn’t give you much in the way of tools to help you do this.
This is possibly the most fundamental underlying issue with using Excel for large models: the way the model is defined in Excel it can get taxing to understand what is actually going on. Here are a few examples of formula from a pedagogical model:
=IF( M12 = 1, 1 / ((1 + $F10) ^ (M11 - 1)), 0)=IF(M20 = 1, INDEX($F15:$F18, M19), 0)=$F29 / $F30 * M32 * $F31 * M33The problem is quite evident - it’s impossible to understand what
this formula is doing without individually looking at the referenced
cells. The first could be written as:
if in-operating-period, 1/(annual-degradation^contract-year-number), else 0.
The last (with a couple of elisions) would be
power-tariff * electricity-generation
Modellers have adopted several conventions for mitigating this problem. First they keep formula very simple, with no nesting, instead favoring additional rows with ‘intermediate’ calculations. Second, keep formula references local, and where necessary have dedicated ‘import’ rows to bring in data from other sheets (note that none of the above formula reference another sheet).
While these are obviously improvements, it does have the consequence of adding a large amount of bloat to models, which has its own legibility penalty. But more importantly it eases but doesn’t solve the fundamental problem that, just by looking at a formula, you can’t tell what it actually does, you have to look at each cell that is being referenced.
The above problem illustrates another: The ‘definition’ of a model is sort of hidden in the output of the model, when in fact they are separable. If you look at a model spreadsheet, where is the model defined? It is in the time-series output, the formula that are copied across the sheet.
In theory this provides flexibility: if you want a model row to have one calculation from period a-b, but a different formula from b-c, you can do that. An experienced modeller, however, will recoil in horror at this suggestion: an inconsistent formula for a row would be nightmare to debug.
This has the interesting outcome that you can theoretically totally separate the definition of the model from its application to results. This would mean you can build and examine the model separately.
That you are unable to do this in Excel, that model and application are inextricably linked by nature of the Spreadsheet conception, harms the legibility of the model, including by introducing the above mentioned formula tracing problem.
The answer of the community to most of these problems has been the establishment of convention. For example, the ‘coding’ of certain colors of text to imply certain things, such as blue text meaning that a row has been ‘imported’ from another sheet. The convention that formula contain lots of white-space, or that sheet-imports are separated from calculations.
This is not much of an answer though. In effect it means that to get a good model you have to [a] be good at modelling [b] know all the conventions, and [c] be extremely disciplined at applying those conventions.
The best way to introduce the framework is to build something in it. Our first task is to model the ‘headers’ of the time series: the period number, and the period start and end dates.
(def inputs
  #:inputs
   {:model-start-date        "2020-01-01"
    :period-length-in-months 3})

(def periods
  #:period
   {:number            '(inc [:number :prev])
    :first-period-flag '(= 1 [:number])
    :start-date        '(if [:first-period-flag]
                          [:inputs/model-start-date]
                          (add-days [:end-date :prev] 1))
    :end-date          '(add-days
                         (add-months "2020-01-01"
                                     [:inputs/period-length-in-months])
                         -1)})

(def model (fw/build-model2 inputs [periods]))
(def results (fw/run-model model 20))
(fw/print-category results :period/number "period" 1 4)
Let’s dig into the elements here.
(def inputs
  #:inputs
   {:model-start-date        "2020-01-01"
    :period-length-in-months 3})
Here we define a couple of simple inputs: The model starts on 1st Jan
2020, and the period length is 3 months (i.e. A period is one quarter.)
Note the format here: we are using a qualified array map, where the keys
are :inputs/model-start-date etc. We will be using
qualified keys very heavily here.
#:period
 {:number            '(inc [:number :prev])
  :first-period-flag '(= 1 [:number])
  :start-date        '(if [:first-period-flag]
                        [:inputs/model-start-date]
                        (add-days [:end-date :prev] 1))
  :end-date          '(add-days
                       (add-months [:start-date]
                                   [:inputs/period-length-in-months])
                       -1)}
Next we get to the meat of the model: a calculation. A calculation is made up of a group of related rows (in the sense of rows on a spreadsheet), each of which have a definition of how to generate a time series. A calculation has the following elements:
The formula themselves are s-expressions - executable code - but in
addition to functions and variables you can also have
references. These are contained in square brackets, and can
reference other rows either inside or outside the calculation.
Referencing [:start-date] will pick up the value of the
start date row from the same period. [:start-date :prev]
will pick up the value from the previous period.
For example, the formula for the row :number (meaning
period number) is (inc [:number :prev]). That is, increment
the previous period number, to generate a time series
[1 2 3 4 ...].
:first-period-flag is a ‘flag’ (Boolean) which is ‘on’
if the period is the first period of the model. The formula
(= 1 [:number]) should be evident, and generates the series
[true false false ...]
The formula for start date is tricker:
(if [:first-period-flag]
  [:inputs/model-start-date]
  (add-days [:end-date :prev] 1))
In English this would be “If it is the first period, take the model start date from the inputs. Otherwise, add 1 day to the previous period end-date”.
start-date:  2022-01-01     2022-04-01   2022-07-01
                ^                ^          ^
        taken from input        calculated from
        for first period        previous end-date
A couple of things to note here: First, we use an if expression and
an add-days function in this formula, the latter of which
is defined as a utility function in the framework but could as easily be
a user defined function. This serves to illustrate that the user has the
full power of the host language available.
The second thing to note is that, till now, we have only seen
local references. That is, references to rows in the same
calculation (:end-date is another example from this
formula). In this formula we also see a reference
(:inputs/model-start-date) to a row in a different
calculation - here the inputs. Note that we have qualified
the reference with the name of the calculation.
The last lines of the program build the model and execute it, printing the following table:
|            :period/number | total |       1.00 |       2.00 |       3.00 |
|---------------------------+-------+------------+------------+------------|
| :period/first-period-flag |     0 |       true |      false |      false |
|        :period/start-date |     0 | 2020-01-01 | 2020-04-01 | 2020-04-01 |
|          :period/end-date |     0 | 2020-03-31 | 2020-03-31 | 2020-03-31 |
That is, what we have created is the start date and end date measures of a time. This simple pattern can be extended infinitely to create the same complexity of models as you can in Excel.
A more complete (though still very simple) model can be seen here, based on the FMWC “Power Up” sample case.
We’ve seen above most of the key elements of the framework. A model is a program which defines how to create a time series ‘period’ from a previous period. A model is built up by defining calculation blocks. A calculation block consists of a name (‘period’), and several rows. A row has a local name and a formula. A formula is an expression which contains functions and references to other rows.
A model is compiled by passing in the inputs, all the calculations, and optionally metadata about the calculations. The model is then run for a given number of periods to generate a result, which can be printed.
The workflow that is intended to be idiomatic in the framework is as important as the framework itself. Generally it’s expected that users will use the framework something like this:
The main problem this framework is trying to solve is that of dependency legibility generally, and the decoupling of the model from the output specifically. The latter it does, by making the model definition a completely standalone thing. The former is more mixed, but positively it is easier to look at a calculation block and see exactly how each row is calculated.
A side effect of this is that it is less necessary to ‘import’ rows from other blocks, which Excel modellers need to do to avoid having calculations to other blocks. By namespacing the blocks and row names, this is much less necessary in the framework, because provenance is much more clear. This would be a calculation block with only local values in calculations, and then with embedded imports.
(def rcf-locals
  #:debt.rcf
   {:period-start   [:period/start-date]
    :period-end     [:period/end-date]
    :rate           [:inputs/rcf-rate]
    :balance-bf     [:debt.rcf.balance/start]
    :interest       '(* (year-frac-act-365 (add-days [:period-start] -1) [:period-end])
                        [:rcf] [:balance-bf])})

(def rcf-embedded-imports
  #:debt.rcf
   {:interest       '(* (year-frac-act-365 (add-days [:period/start-date] -1) [:period/end-date])
                        [:inputs/rcf-rate] [:debt.rcf.balance/start])})
Which is preferred is ultimately a stylistic choice, but personally I don’t find the latter any harder to read than the former.
Apart from this, the problem of version control is solved by virtue of having the model defined in plain text. However all VC of results is not part of the framework. The reliance on VBA is obviously eliminated. Circularity is checked at compile time, and the user has facility to examine a full dependency graph. Speed is (so far) not a problem, though when the models start to get very large I’m by no means sure that this will be faster. Even with smallish models (~200 rows, ~200 periods) it can take a couple of hundred ms to run the model. But we’ll have to see.
When it comes to model legibility there are some trade-offs to be made. But the big, honking hole in the framework is the legibility of results. In short, for both modelling and examining results, you really miss the rich formatting abilities of Excel, and just the ability to see everything. Working locally is fine, but you really want to be able to know what’s changed in your results set as a consequence of your changes. You want to be able to mark things on the sheet, use different colors, use different font sizes for headings etc. Excel is so great at this, and it’s very hard to replicate. Ultimately the current printing of results sets needs to be replaced with something that is more flexible and more format-rich.
The actual syntax of model building is OK, but not fantastic. The
building of maps is a bit clunky. This could easily be fixed with a few
helpers. More difficult is some of the expression re-writing stuff. Take
this calculation definition, which dynamically adds contracts to a
contract revenue calc block depending on which ones are ‘on’ in the
inputs. The ability to do something like this is a significant benefit
over Excel, which struggles with this kind of dynamism (you would
effectively have to build a bunch of tables to do look-ups). However the
(list '* [...]) stuff, which is building an expression the
model can evaluate, is pretty conceptually complicated programming -
effectively meta-programming - which is likely beyond the capabilities
of a user whose expertise is in modelling, not programming.
(def contract-revenue
  (fw/add-total
   :total
   (into (array-map)
         (for [c contract-activity]
           (let [input-qualifier (str "inputs.contracts." (name c))]
             [(keyword "contracts.revenue" (name c))
              (list '* [(keyword input-qualifier "revenue")]
                    [(keyword input-qualifier "completion")])])))))
One thing I thought would be a big benefit, but turns out to be less so, is the ability to use the full scope of the host language. In reality, the vast majority of the rows use only a few functions - conditionals, arithmetic, date functions. You just don’t really need much more than that. Having a proper branching conditionals was helpful, but that’s the only circumstance where I had to do something Excel can’t.
Here are the things that will be crucial to getting this within a country mile of MVP:
This is the most critical thing. The printing of tables in the REPL in plain text is not good enough.
The user should have the ability to set up their own checks (e.g balance sheet doesn’t balance), and on running the model they should be warned if any of these checks are off.
The user should be able to run multiple scenarios based on different input values and compare the outputs of those.
When the user runs the model, they should be able to see what has changed from the last time they ran the model.